


Rendering the Field Lines of the Mandelbrot Set
1024x771 282K 8-bit GIF
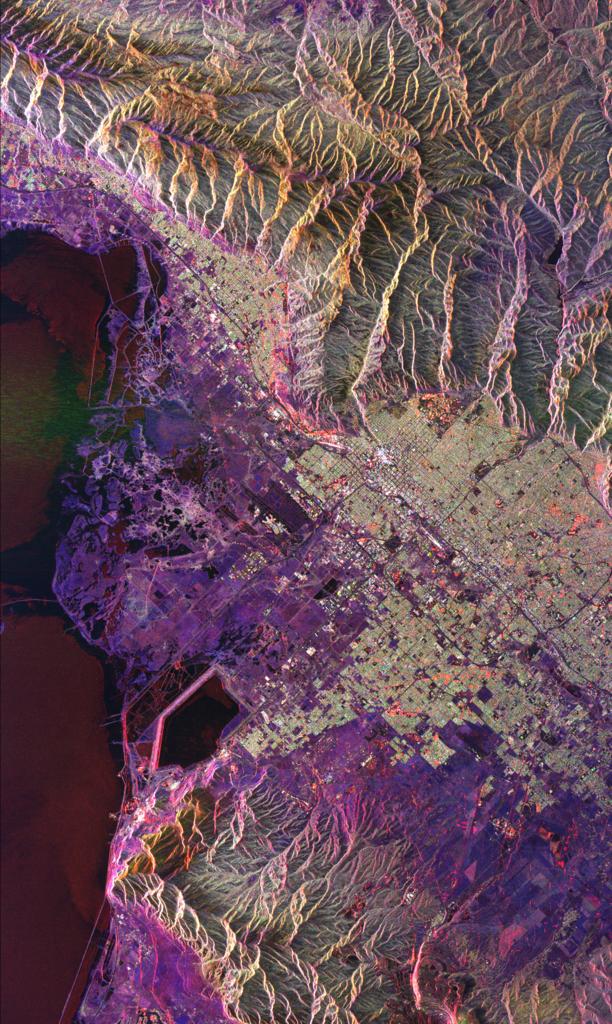
This image was created by taking the Mandelbrot set and coloring the exterior points of the set with a carefully chosen colormap and fractint's external angle decomposition option. The image is an attempt to render the field lines of M directly.
Normally M is rendered by showing the level sets, which are lines of constant iteration. The corresponding field lines are perpendicular to the curves of constant iteration.
Field lines come from electrostatic theory, in which M is visualized to contain an evenly distributed charge. The electrostatic field created by this charge is then visualized graphically. This is how most "height field" renderings of M are created, especially the ones in the Beauty of Fractals or other books by Peitgen et al. Fractint has the capacity to create the potential images directly (and save them at 16 bits per pixel to give extra accuracy). This is a great way to generate depth maps for SIRDS, incidentally.
This image was created form a PAR file by Jay Hill. The image was 3x oversampled in fractint by using its 'disk video' rendering mode and then downsampled using a Mitchell filter and Paul Heckbert's zoom program