A composite color television signal is actually made up of three separate signals: luminance, chrominance (color), and sound. The original NTSC television standard allowed a bandwidth of 6MHz from one channel to the next. Most of that space is taken up by the luminance signal, which is an amplitude-modulated signal. The sound channel is a frequency-modulated signal at the high end of the bandwidth. The sound isn't important for the rest of the video discussion.
Vertical blank and horizontal blank are integrated into the luminance signal. Luminance is actually white at an amplitude of 0, and black at full amplitude. During the blanking periods, pulses are generated at higher than normal black amplitudes. Television receivers can lock onto these pulses to synchronize the vertical and horizontal hold. A typical scan line of black and white video might look something like this (drawing is not to scale; I'm a terrible freehand artist):
When color was introduced, it had to be designed so that the black and white portion of the signal would remain the same, even though color televisions use a triad of red, green, and blue to make color. So instead of creating three separate RGB signals, the HSB (Hue-Saturation-Brightness) model was developed. The hue and saturation would be combined into a new signal that is squeezed between the luminance and audio signals.
There are two ways of looking at how the hue and saturation are combined. The first view, which makes the resulting signal easier to understand, is that it's both phase-shifted and amplitude-modulated. The amplitude of the signal determines the color saturation, and the phase determines the hue. Thus, if the amplitude of the color signal is 0, you have no saturation and the result is the same as a black and white signal.
In order to see how this relates to CTIA, it is necessary to picture the chrominance signal added to the luminance signal. In order to keep the signals distinct, television receivers are designed to ignore fluctuations in the luminance signal above a certain frequency. The chrominance signal is defined at a frequency of 3.58MHz. Therefore, when the luminance signal is extracted it is taken to be the average amplitude over a period of one or more chrominance cycles. Now, according to De Re Atari, CTIA is able to change the luminance signal at a rate of 7.16MHz when it is displaying one of ANTIC's luminance-only modes. So if you have a display line that changes the luminance from 0 to 14 and back repeatedly, you are actually simulating a constant 3.58MHz waveform, thus tricking the television into believing that it actually has a chrominance signal with a constant amplitude.
Luminance signal alternating 0's and 1's
Constant chrominance signal
The hue is determined by the phase shift of the chrominance signal, but to determine the phase there must be a reference signal. This reference is provided in the form of a "color burst", which is a fixed-phase chrominance signal of at least 8 cycles performed during each horizontal blank period. The difference between the high points of the chrominance signal in relation to those of the color burst determines the hue that will be shown. This explains why you get two different colors depending on whether your display line has points drawn on even pixels or on odd pixels. It also shows that drawing the line just a fraction of a pixel off can dramatically change the hue. Compare the output of the original CTIA chips with the newer GTIA chips.
In order to learn exactly what colors are produced, however, you must change your view of the chrominance signal from a phase-shifted signal to two separate amplitude-only signals that are superimposed. This is achieved by keeping the signals at the same frequency of 3.58MHz, but shifting one signal by 90º with respect to the other so that the peak value of either signal coincides with the 0 value of the other, as follows:
The magenta curve represents the combined color signal. Every 90º, the signal can be sampled with respect to one of the two reference signals to find the amplitude of that signal. As shown in the diagram, the red amplitude is found at the red lines and inverted at the cyan lines, and the blue amplitude is found at the blue lines and inverted at the yellow lines. To achieve the translation of B/W luminance into RGB levels, the reference signals above are used to generate and decode two difference signals: R-Y and B-Y, which represent the amplitude difference between overall luminance (Y) and the red and blue colors. Since we now know the amount of red and blue that contribute to the overall luminance, green can be computed from the luminance left over. That completes the RGB signal.
At this point, it is worth noting that since Atari's luminance signal changes at 7.18MHz, each cycle covers 180º of the color signal. That means that it always covers two adjacent peaks of the R-Y and B-Y references. It just so happens that the CTIA chip covers [-(R-Y), +(B-Y)] and [+(R-Y), -(B-Y)], and GTIA covers [+(B-Y), +(R-Y)] and [-(B-Y), -(R-Y)]. This fact lets us compute precisely what colors will result from oscillating the luminance at any given levels. But first, we need some formulas.
In determining the relationship between RGB color and Black and White, it was found that each color contributes the following amount to the overall brightness:
| Red | 30.0% (3/10) |
| Green | 58.9% (53/90) |
| Blue | 11.1% (1/9) |
The RGB components are computed from the input signals according to the following formulas (where Y indicates luminance):
R = Y + (R-Y)
G = Y - (27/53)(R-Y) - (10/53)(B-Y)
B = Y + (B-Y)
Using these equations, we can now determine what colors will result with alternating luminances. For example, using a luminance-only mode with a black background and a foreground color E, the television is tricked into thinking the luminance is at 7 and there is a color signal with an equivalent saturation level. The possible colors are:
| Color | R | G | B |
| CTIA orange | 100% | 34% | 0% |
| CTIA cyan | 0% | 84% | 100% |
| GTIA green | 0% | 85% | 0% |
| GTIA magenta | 100% | 15% | 100% |
(By the way, have you noticed on the old Atari 800 demo program how it used to make accurate colors for the simulated computer screen and console buttons in graphics mode 8? That was CTIA cyan and CTIA orange. The same colors were also used in Choplifter to make the american flag at the embassy. I wonder what country uses a green and purple flag?)
 Now we must revert to the model of a single phase-shifted
signal in order to discuss the concept of hue. Although chrominance is
actually made up of separate R-Y and B-Y signals, it is convenient to
think of the addition of these signals as a single waveform that
shifts phase to create a continuous range of hues. It also appears to
be the only explanation of how CTIA/GTIA generates colors. As shown on
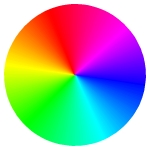
the color wheel on the left, pure red is not exactly at 90º and
pure blue is not at exactly 180º. This is because green must be
extrapolated from the R-Y and B-Y signals. When you select a color on
the Atari, C/GTIA actually converts the hue to a phase shift of its
chrominance signal. The formula appears to be
190º - 27º × hue for hues from
1-15. The approximate 'angles' for the principle colors are:
Now we must revert to the model of a single phase-shifted
signal in order to discuss the concept of hue. Although chrominance is
actually made up of separate R-Y and B-Y signals, it is convenient to
think of the addition of these signals as a single waveform that
shifts phase to create a continuous range of hues. It also appears to
be the only explanation of how CTIA/GTIA generates colors. As shown on
the color wheel on the left, pure red is not exactly at 90º and
pure blue is not at exactly 180º. This is because green must be
extrapolated from the R-Y and B-Y signals. When you select a color on
the Atari, C/GTIA actually converts the hue to a phase shift of its
chrominance signal. The formula appears to be
190º - 27º × hue for hues from
1-15. The approximate 'angles' for the principle colors are:
| Yellow | Red | Magenta | Blue | Cyan | Green |
| 172.9º | 113.2º | 45º | -7.1º | -66.8º | -135º |
| 1, 14 | 3 | 5 | 7 | 9 or 10 | 12 |
If we use the hue phase shift (Ø) and the saturation level (S) in the previous RGB equations, the new equations become (pretending Ø is the greek letter Theta):
R = Y + S × sin Ø
G = Y - (27/53) × S × sin Ø - (10/53)
× S × cos Ø
B = Y + S × cos Ø
The equations for -(R-Y), +(B-Y), +(R-Y), and -(B-Y) may also be represented as a single continuous function of T, where -(R-Y) is sampled when T=0, +(B-Y) is sampled when T=PI/2, etc. A continuous function more accurately represents the output of the GTIA chip, since it (apparently) uses a constant amplitude for the phase-shifted chrominance signal. This equation is simply:
f(T) = Y - S sin (T - Ø)
Now we finally get the the hard part: what kind of artifacting is done on the boundary between two arbitrary colors? The simple equations given above no longer suffice, because now you have to account for the transition of the chrominance signal from one saturation level to another with a difference in phase shift, plus the effect of all that on the perceived luminance level. Depending on the colors involved, this may result in a band that's lighter or darker than either of the surrounding colors, and less noticeably, a change in hue.
Let's start with a couple of modifications to our RGB equation. First, we need two Ø's: Ø' is the phase shift of the left pixel's color, and Ø'' is the phase shift of the right pixel's color. Likewise, Y' and Y'' are the real luminance of the left and right pixels. There are two possible ways a television might extract luminance: it might extract the signal level discreetly each time it samples R-Y and B-Y, and average the peaks with the valleys; or it may look at the luminance component as a continuous function averaged over 279 nanoseconds (using some kind of analog filter.) For simplicity, we'll try the discreet approach.
In all Atari color graphic modes, a pixel covers an integral multiple of wavelengths of the chrominance signal. Using the CTIA model, this gives us the following signal levels (over two pixels):
[1] Y - (R-Y) = Y' - S sin Ø'
[2] Y + (B-Y) = Y' + S cos Ø'
[3] Y + (R-Y) = Y' + S sin Ø'
[4] Y - (B-Y) = Y' - S cos Ø'
[5] Y - (R-Y) = Y'' - S sin Ø''
[6] Y + (B-Y) = Y'' + S cos Ø''
[7] Y + (R-Y) = Y'' + S sin Ø''
[8] Y - (B-Y) = Y'' - S cos Ø''
At [4], the luminance is the average of [1]..[4], which you can easily see is Y' (the original luminance of the first pixel). At [5], the luminance changes by S×(sin Ø' - sin Ø'')/4. At [6], the luminance is changed by S×(sin Ø' - cos Ø' - sin Ø'' +cos Ø'')/4. At [7], the luminance varies by S×(cos Ø'' - cos Ø')/4. By [8], the luminance is back to its correct value of Y.
Let's try plugging some numbers into that formula, say from red (109º) to pink (82º). [5] gives us a change in luminance of 1% of S; not significant. [6] and [7] on the other hand give us a 11%×S increase in luminance, which may be noticable. (Compare with the bottom row of the screen capture shown above.)
Now try some colors that are far apart, such as orange (136º) to cyan (-53º). [5] gives us a increase in luminance of 37%×S, [6] gives us 70%×S, and [7] gives us 33%×S. There will definitely be banding here. Note that swapping the pixel colors simply gives us the reverse effect; you will see a darker band where orange lies to the right of cyan.
This curve illustrates the artifacting effect. As you can see in the middle of the graph, there are four samples in a row where the waveform is high above the base luminance. This not only confuses the TV into thinking the luminance has gone up (indicated by the gray curve), but also that the color saturation has been reduced to almost nothing (it is 5% of the actual saturation). The result is an off-white bar.
 Back to Atari Technical Information page